
Wildlife H.E.R.O. focuses on research and initiatives related to wildlife health and ecology.
This is achieved through four areas of expertise:
1. Research and monitoring. We monitor and sample wildlife populations to study their ecology, using a combination of field work, lab work and state-of-the-art statistical and mathematical modeling.
2. Disease and pathogen research. We study the disease ecology of pathogens in wildlife to quantify the drivers behind transmission and spillover between different species including humans.
3. Analytical tool development. We develop data-driven models that can be used as a tool to facilitate decision-making.
4. Conservation and wildlife management. We work towards applying our research to the conservation and management of wildlife in their natural habitat or facilities such as rehabilitation centers.

Most of our research is conducted in collaboration with academic institutions and non-profit organizations. Current and past collaborative projects include:
-
with Prof. Jamie Lloyd-Smith at UCLA: transmission of Leptospira in California Sea Lions and Island foxes.
-
with Prof. Raina Plowright at Cornell University: dynamics and spillover of coronaviruses and henipaviruses in flying foxes.
-
with The Marine Mammal Center: mitigation of entanglement in California Sea Lions.
-
with U.S. Fish & Wildlife: participation in the Eastern Pacific Marine One Health Coalition (marineonehealth.org), incl. the development of a leptospirosis outbreak dashboard.
-
with Dr. Alison Peel at the University of Sydney: dynamics of henipaviruses in flying foxes in Australia, flying fox ecology, and trying to uncover the mystery cause of outbreaks of an illness causing flying foxes to become paralyzed.
-
with Dr. Lorraine Barbosa at Oiled Wildlife Care Network: analysis of Guadalupe Fur Seal anesthesia data.
A selection of projects is shown below.
Note that projects include those that were done by Benny Borremans prior to
the initiation of the Wildlife Health Ecology Research Organization.
List of publications (including full text PDFs).
(click on an image to read more)


Ecological drivers of disease spread
Where do infectious diseases come from?
How do they spread in nature?
What are the forces driving their transmission?
A key focus for our research is to observe, measure and analyze the ecological drivers of transmission.
(move your cursor over the box to read more)
Population density, contact rates and transmission


When transmission depends on contacts between individuals, and if the rate of contacts can change with population density, transmission is likely to be density-dependent. Density-dependent transmission is a central concept in disease ecology and epidemiology, but testing it has proven difficult due to the fact that it requires elaborate experiments in which the density of a population is altered while measuring contacts and transmission.
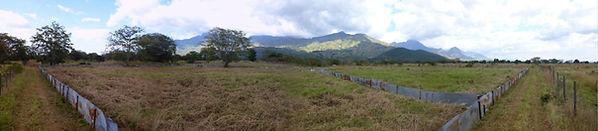
Through field experiments in Tanzania we found that rodents change their number of contacts depending on how many other rodents there are, and that contacts are a sigmoidal function of density: at low densities they maintained a minimum number of contacts, while contacts increased linearly with density until reaching a certain maximum level.
We then combined these data with a mathematical model of transmission in which we simulated transmission in a realistically fluctuating rodent population.
This showed us that the way in which contacts change with density can have significant effects on whether a pathogen can persist in the population.
(Borremans et al. 2017 Royal Society Open Science)
This work was done at the University of Antwerp (Belgium) with Prof. Herwig Leirs, Dr. Jonas Reijniers and many others, in collaboration with the Sokoine University of Agriculture (Tanzania)

(move your cursor over the box to read more)

Environment, immunity and transmission


Disease transmission can be governed by a variety of forces that typically fall into one of two categories: intrinsic or extrinsic drivers.
Intrinsic drivers those that arise from the host-pathogen system itself. Immunity is a common intrinsic driver, as changes in the proportion of immune individuals can cause transmission rates to vary. Another potential driver is behavior, for example when contacts between individuals change during seasonal breeding.
Extrinsic drivers are those that are not part of the host-pathogen system. These can be environmental factors (temperature, humidity, ..) that change pathogen survival and transmission, or the presence of other species (predators, competitors, ...) that affect contacts, survival or health.
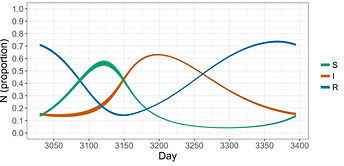
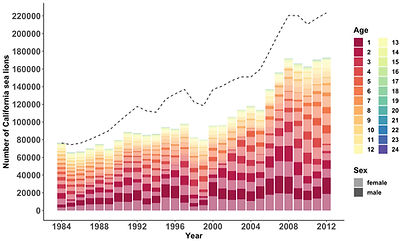
Using machine learning, we analyzed a 29-year time series of leptospirosis outbreaks in California sea lions, and found that both intrinsic and extrinsic drivers are important determinants of outbreak size. The intrinsic driver was the proportion of susceptible individuals in the population (more susceptibles = larger outbreak), while the extrinsic drivers were oceanographic factors related to sea lion movement and mixing, and sea lion health.
These results also motivated us to set up simulations to get a sense for how climate change might affect leptospirosis outbreaks. These simulation models suggest that outbreaks will on average become smaller but occasionally more extreme due to larger environmental variation.
A crucial part of this work is the development of a method to reconstruct a time-series of the proportion of susceptible sea lions in the population, which is age- and sex-specific. In one of the boxes below you can find more information about this exciting susceptible reconstruction.
This work was done at UCLA (US) with Prof. Jamie Lloyd-Smith and Dr. Katie Prager, and many others including The Marine Mammal Center and the NOAA Marine Mammal Laboratories.
COVID-19
Collecting data in nature
Estimating time of infection, analyzing serological data
When were individuals infected?
How do antibody levels change after infection?
The time of infection of individuals in a population is used to reconstruct incidence time series of pathogen transmission.
Because it is impossible to sample every individual every day to catch the moment they become infected,
time of infection and incidence must be estimated using sparser data.
Over the last years, significant advances have been made on time of infection estimation methods.
Using wildlife study systems we have developed a strong interest in these methods, and have been thinking a lot about how we can advance them.
(move your cursor over the box to read more)
Estimating time of infection using different sources of information.
Part 1: using experimental data.

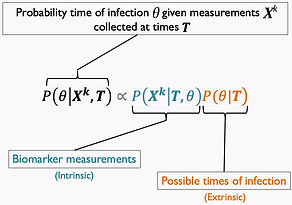
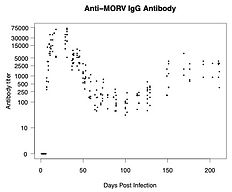

When antibody concentrations decay at a predictable rate after infection, the concentration at any given time point can in theory be used to back-calculate when infection occurred.
Such antibody-based back-calculation methods have been developed for HIV (Brookmeyer) and other diseases (Teunis, Kretzschmar, Hens), but never to wildlife systems.
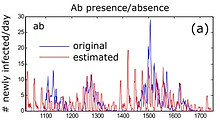
Using arenavirus infection in multimammate mice, we developed a new approach to estimating time of infection. It uses a Bayesian framework that allows incorporating all sources of information about time of infection, instead of only antibody concentration.
Examples of other sources of information:
-
Pathogen presence/concentration
-
Disease symptoms
-
Disease seasonality
-
Age
We found that combining information dramatically improves time of infection estimates and incidence reconstruction.
More information about this work can be found in Borremans et al. 2016.
This work was done at the University of Antwerp (Belgium) with Prof. Herwig Leirs and Dr. Jonas Reijniers, Prof. Niel Hens and Prof. Philippe Beutels.

(move your cursor over the box to read more)

Estimating time of infection using different sources of information.
Part 2: no experimental data available.

This work was done at UCLA (US) with Prof. Jamie Lloyd-Smith and at Hasselt University (Belgium) with Prof. Niel Hens.
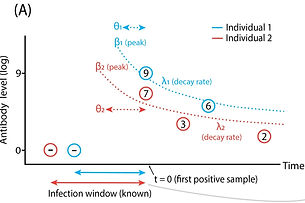
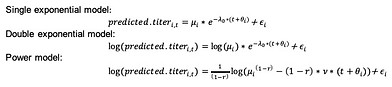
Estimating time of infection using antibody concentrations or other data requires a model that describes how the measured variable changes after infection. In the case of antibodies, that means having a model that describes antibody decay. These models can then be used to extract time of infection information from new data.
Such models are ideally constructed using experimental data for which the time of infection is known. A common problem however is that such data do not exist for many pathogens and host species, and this problem is holding back the widespread use of time of infection estimation methods.
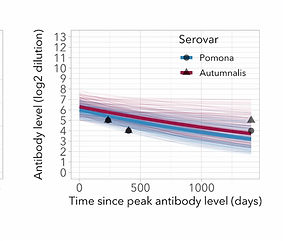
We used data on the antibody response against Leptospira sp. in Channel Island foxes to develop an approach that allows the construction of antibody decay models without the need for experimental data.
The approach uses Bayesian MCMC to incorporate different sources of prior information about peak antibody level and possible infection windows (birth date, last negative sample, ..).
This approach opens up many datasets to time of infection estimation methods, and offers the potential to improve incidence time series for many pathogen-host systems.
This work was published in Methods in Ecology and Evolution, and can be downloaded here.
Pathogen spillover
When and where should we expect pathogen spillover between species?
How can we improve theory and concepts to better understand spillover processes?
Spillover is the process where parasites/pathogens cross the species barrier.
It drives the emergence of new infectious diseases and outbreaks of zoonoses, and can result in horrible pandemics like the 2014 Ebola outbreak in West Africa or the 2020-20?? SARS-CoV-2 crisis.
Spillover is notoriously difficult to study because actual spillover events are almost impossible to detect in real-time.
Almost all research on spillover relies on post-hoc inference using genetics and serology.
And despite large efforts by projects such as PREDICT, we are still far from being able to predict which pathogens will spill over next into humans, and even more elusively when and where this will happen.
Inspired by, amongst others, Jamie Lloyd-Smith's field-advancing ideas on spillover we have been thinking deeply about this topic, and a while ago had the opportunity to contribute to a special issue on spillover of the Philosophical Transactions of the Royal Society that resulted from an expert workshop organized by Raina Plowright in 2018.
(move your cursor over the box to read more)
On the spillover of pathogens across ecosystems
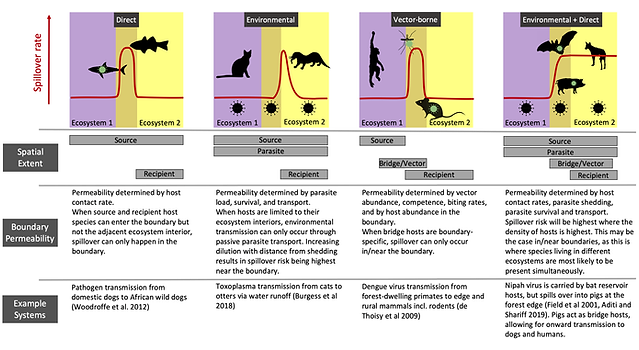
Spillover has been hypothesized to happen more frequently at the boundaries between ecosystems.
This is largely based on the observation that many spillover events have occurred in fragmented landscapes and in situations where people live in close contact with wildlife.
Evidence for this hypothesis is not entirely conclusive though, as it is tricky to observe rare spillover events.
We dove into this topic by approaching it from different angles, and borrowing insights from related fields like movement ecology and macroecology.
We asked whether we should indeed expect spillover to be more likely at ecosystem boundaries, and which processes should be the most important drivers.
A central part of this paper is the application of the concept of permeability, borrowed from movement ecology, to pathogens. In this context, permeability is the degree to which pathogens are able to cross an ecosystem barrier. This depends on several factors like host movement, ecosystem boundary-area ratio, pathogen prevalence and edge biodiversity effects.
If you are interested, you can download the paper here:
This work was done at UCLA with Prof. Jamie Lloyd-Smith.

SARS-CoV-2 / COVID-19
How long after developing symptoms can antibodies be detected?
How does the detection probability of viral RNA and antibodies change over time?
What are the antibody kinetics during the early phase of infection?
Understanding SARS-CoV-2 infection and transmission requires knowledge of the underlying patterns of virus and antibody dynamics.
If we want to develop good data-based models, we need to quantify when antibodies and viral RNA can be detected and how this changes after infection.
Despite the incredible number of studies being published from the start of the COVID-19 pandemic, these data were difficult to extract and collect from the numerous smaller studies.
We performed a meta-analysis of antibody and RNA dynamics after symptom onset, with the goal of providing robust quantitative estimates that include variation and confidence intervals.
(move your cursor over the box to read more)
Meta-analysis of SARS-CoV-2 antibody and RNA detection

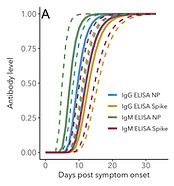

We extracted data from 22 published studies that reported original IgG and IgM antibody presence and concentration data, as well as RNA presence data, all relative to time since symptom onset.
These data were collected at different laboratories, using different assays, and from different study populations, which means care had to be taken to integrate these data.
To do this, we developed new statistical methods that provided estimates of mean values as well as the variation around these means.
This included the development of a stepwise hierarchical bootstrapping method that gives more weight to higher quality data.
The estimates derived in this meta-analysis are proving useful for interpreting antibody and RNA data, and for parameterizing mathematical models of SARS-CoV-2 transmission.
More information: Borremans et al. 2020 eLife.
This work was done at UCLA with Prof. Jamie Lloyd-Smith.
Predicting sea lion survival following leptospirosis
When a California sea lion is rescued after stranding due to leptospirosis, what are its chances of survival?
Which individual variables correlate with disease severity?
Leptospirosis, a kidney disease caused by the bacteria Leptospira interrogans, is one of the leading causes of stranding for California sea lions. At the Marine Mammal Center in San Francisco, the world's largest marine mammal rescue & rehabilitation center, between 20 and 300 sea lions suffering from leptospirosis are treated every year. Mortality rates are high, and over 70% of affected stranded sea lions ends up dying from the disease.
During intense outbreak periods the number of rescued sea lions can increase rapidly, which means that veterinary clinicians need to diagnose the animals as quickly as possible, and assess which individuals should be euthanized.
In order to facilitate this decision, we have developed a statistical tool that predicts sea lion survival probability using only 2 sources of easily obtainable data.
This tool was published in the Journal of Zoo and Wildlife Medicine, and is now being used to improve the treatment of sea lions affected by leptospirosis.
(move your cursor over the box to read more)

Statistical classification tree model to predict sea lion survival
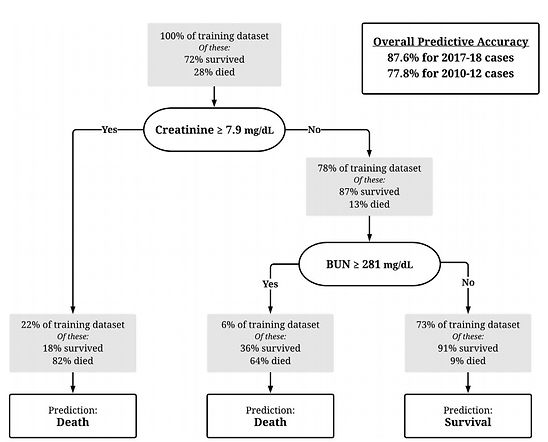
We fitted a "classification and regression tree" model (CART), a machine learning method, to predict the survival of individual sea lions. This approach models the correlation between the outcome variable (survival) and other variables using a classification tree that uses simple binary decisions to predict whether the individual will survive or not.
Different combinations of multiple variables were used to fit the model, including blood chemistry measurements (BUN, Creatinine, Sodium, ..) and behavioral observations (eating behavior). Predictive accuracy (tested using cross-validation) was highest when using only 2 (!) variables (BUN and Creatinine, both known to be indicators of kidney functioning).
Using these variables, survival could be predicted correctly for 87.6% of cases.
This simple model is highly useful as an objective tool to facilitate the hard decisions that need to be made by veterinary clinicians, and will be particularly useful during large outbreaks that can overwhelm the staff and rescue center.
More information: Whitmer et al. 2021 Journal of Zoo and Wildlife Medicine.
This work was done while at UCLA with Prof. Jamie Lloyd-Smith, in close collaboration with The Marine Mammal Center.
Sea lion entanglement mitigation
How widespread is the entanglement problem in California sea lions?
Are entangled sea lions observed across the US West Coast, and have observations changed over time?
A major threat for sea lions, and other marine mammals, is entanglement with debris or fishing gear. Imagine getting a packing strap, or a hard plastic fishing line, stuck around your neck when you are 4 years old, and there is no way to get it off so it just stays there and you have to deal with it while it limits your movement. As you grow older and larger, the entanglement does not stretch, which means it digs deeper and deeper until it cuts through all the skin, muscle and even your throat and trachea.
It is horrendous to even contemplate, but it is the fate of many sea lions each year.
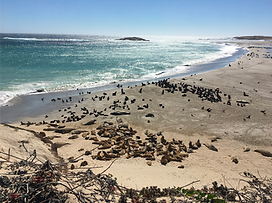
At stranding and rescue centers along the United States West Coast, entangled sea lions are being treated regularly. In monitored populations, such as the San Miguel island rookery, entangled sea lions are seen year-round.
Entanglement is a major threat for individual sea lions, but we don't actually know how widespread the problem is, and whether entanglement risk has changed over time.
Major questions include:
-
Are entanglements observed in the entire range of the population?
-
Which sea lions become entangled? All sexes, ages and sizes?
-
What is the most common type of entanglement? Fishing gillnets? General debris?
-
Has the threat changed over time? Is it increasing or decreasing?
If we want do something about this problem, the first step is understanding the problem. If we know what the sources of entanglement are, where they occur, which and how many sea lions are affected, we can start figuring out whether there are any solutions.
This is the goal of a collaborative project between The Marine Mammal Center and the National Marine Mammal Lab (NOAA Fisheries), funded by a NOAA Prescott grant (led by co-PIs Tenaya Norris and Benny Borremans).
The project is nearly finalized and a publication is being drafted.
